Physical Address
304 North Cardinal St.
Dorchester Center, MA 02124
Physical Address
304 North Cardinal St.
Dorchester Center, MA 02124

Claude Design has effectively lowered the bar for non-designers.
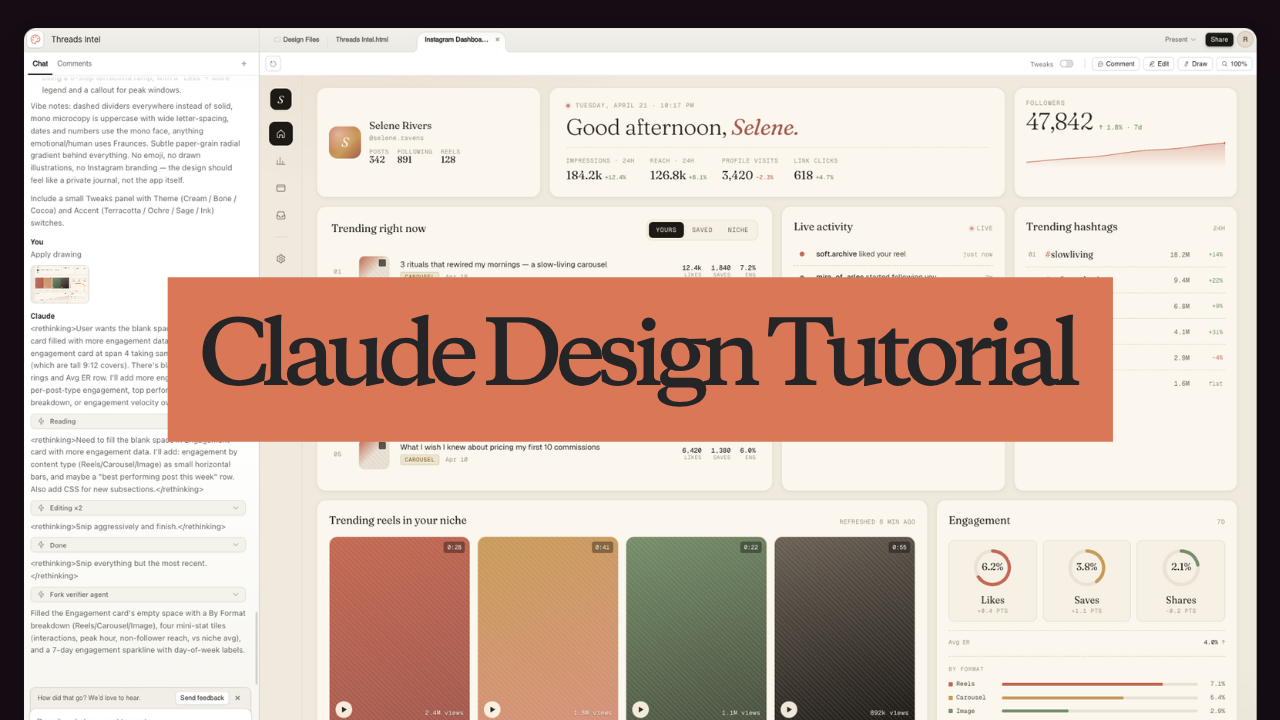
I do a lot of content marketing, and I spend far too much time clicking between different social platforms to check analytics. I wanted one dashboard to see everything, but I am not a UI designer. This Claude Design tutorial walks you through how I built a custom, “Moleskine-style” Instagram dashboard using simple text prompts.
Claude Design is a specialized frontend development workspace within Anthropic’s Claude platform. It uses the Opus 4.7 model to generate, preview, and edit user interface layouts in real-time based on natural language prompts.
If you do not have a Claude account, create one. The Pro plan works for basic tests. However, if you want to follow this Claude Design tutorial closely and iterate on complex layouts, I suggest the Max plan.
Claude Design uses Opus 4.7. It is incredibly capable, but it burns through tokens fast. I use the Max 20X plan (£200) because getting a polished design usually takes a few back-and-forth edits.
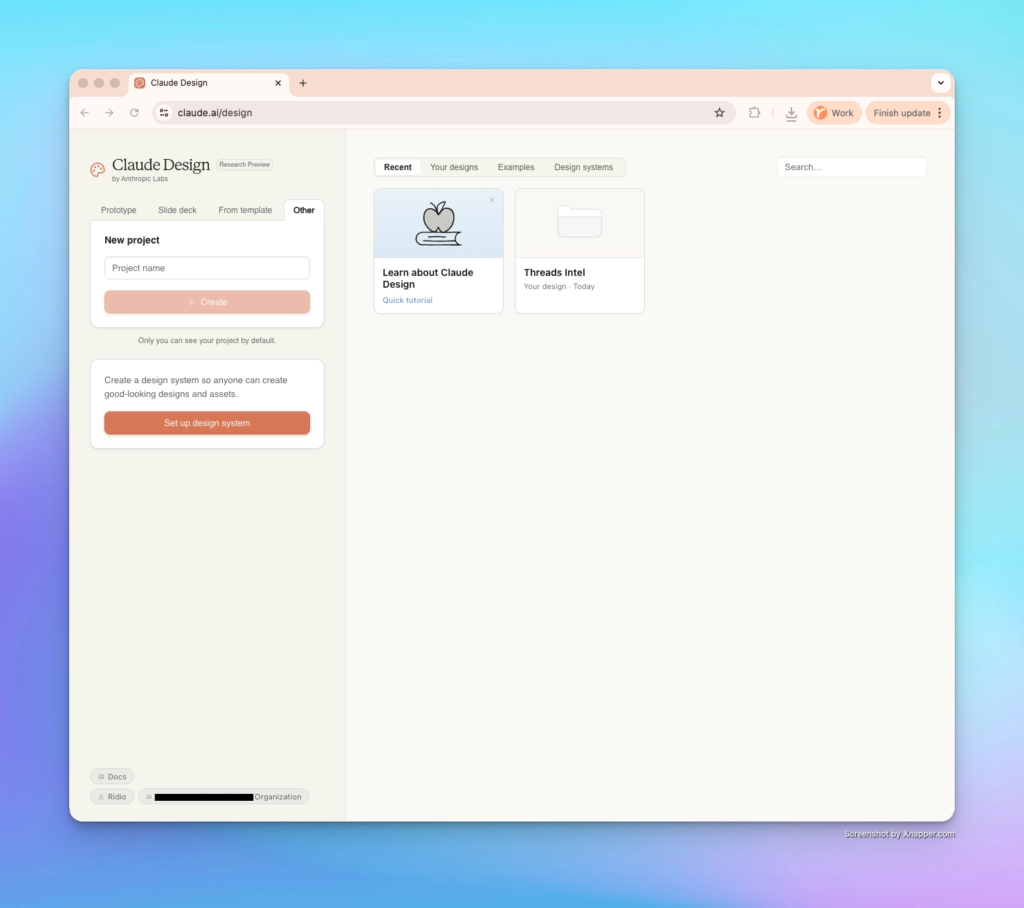
Navigate to claude.ai/design. Note: This interface is currently browser-only. If you use the Claude desktop app, you won’t find the design-specific tools there yet.
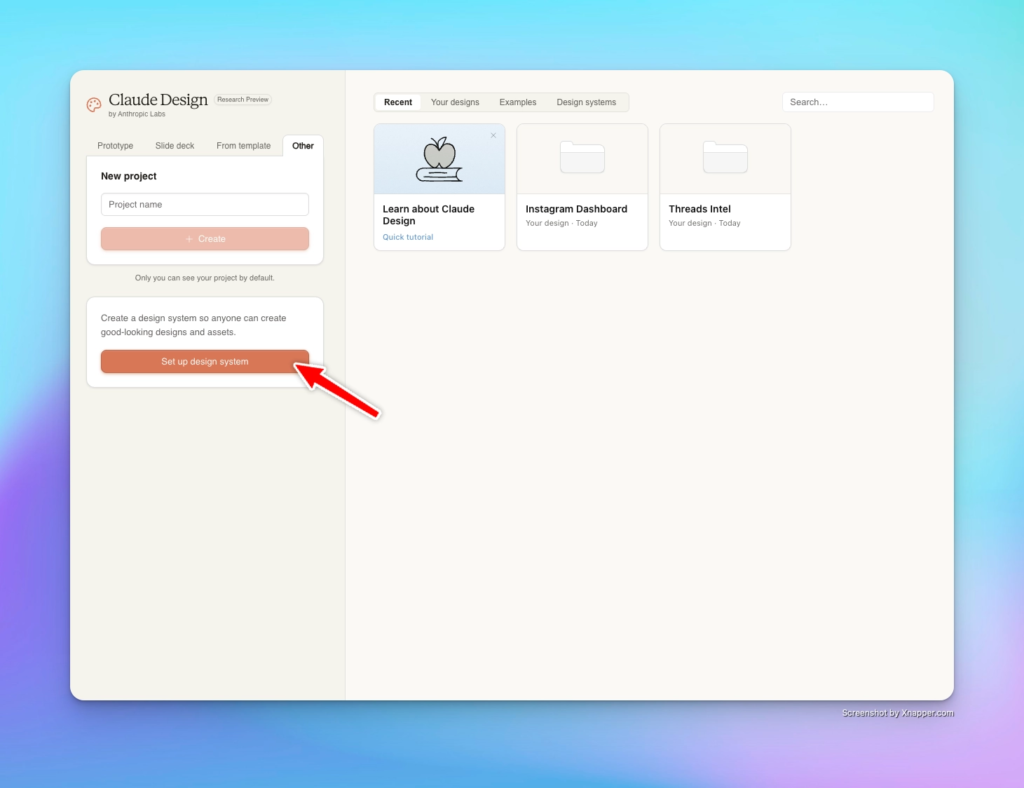
Setting up a design system gives the AI boundaries. If you skip this, it defaults to standard Claude branding (purples and generic fonts).
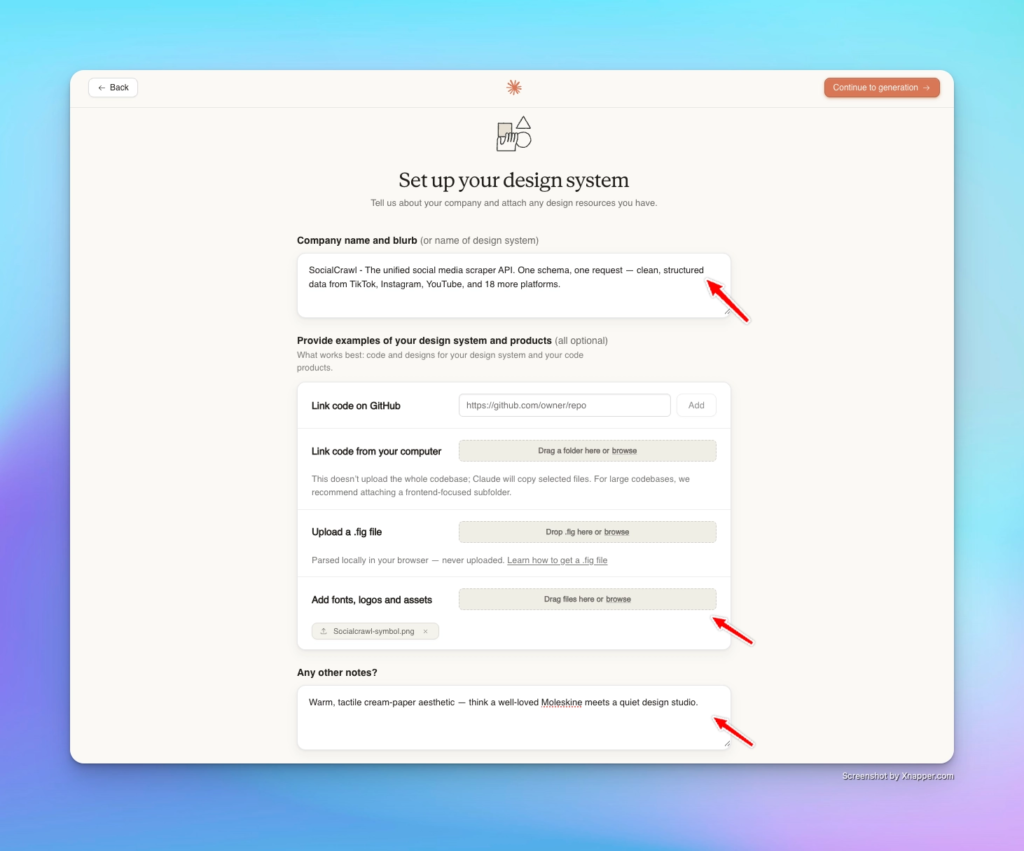
Fill in:
For this specific layout, I intentionally left the design system blank. I wanted to see how well it could follow a highly specific aesthetic prompt from scratch.
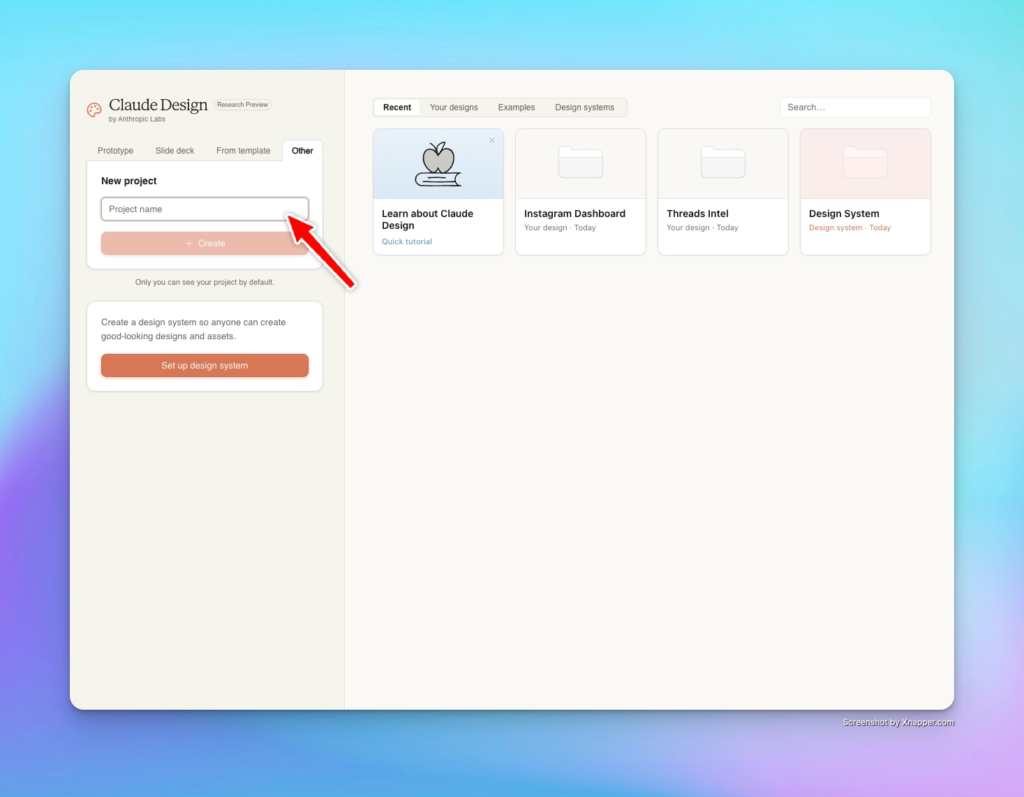
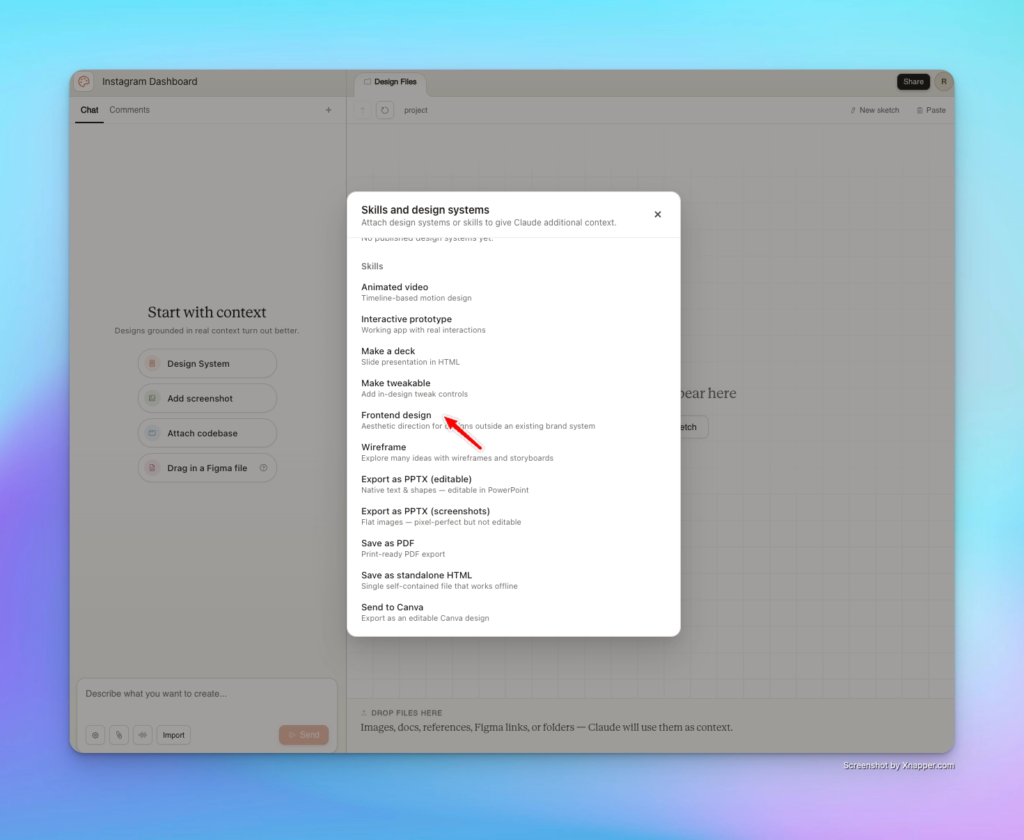
Start a new project and select your design system. Make sure you select the “Frontend design” skill. This explicitly tells the AI to prioritize visual hierarchy and UI best practices.
I want to build a social media dashboard for instagram that show me these analytics:
Copy and paste this prompt to generate the layout:
Design a personal Instagram analytics dashboard for a single user named Selene. Warm, tactile cream-paper aesthetic — think a well-loved Moleskine meets a quiet design studio. Not dark mode, not tech-bro neon. Soft ivory background (#efe9de-ish), creamy card surfaces, terracotta and ochre accents, with Fraunces as the display serif and Geist + Geist Mono for UI.

Layout: thin left icon rail, then a 12-column grid of cards with generous rounded corners (16px), 1px hairline borders, and the gentlest drop shadow. Every row should sum to 12 columns — no lonely cards on the right.

Row 1 — hero strip:

Profile card (3 cols): gradient-tiled avatar, name in serif, @handle in mono, and three tiny stats (Posts / Following / Reels).
Greeting card (6 cols): live date + time with a pulsing dot, a big italic-accented "Good afternoon, Selene." in Fraunces ~38px, and a dashed-rule divider above four KPIs (Impressions, Reach, Profile visits, Link clicks) each with a colored delta.
Followers card (3 cols): huge serif follower count, growth delta, and a filled-area sparkline.

Row 2:

Trending posts (6 cols): ranked list, type-tagged (Carousel / Reel / Image) with colored pills, thumbnails with subtle 45° hatch pattern and reel/carousel corner marks, and right-aligned mono numbers for likes / saves / eng%.
Live activity ticker (3 cols): small colored dots (like = terra, comment = ochre, follow = sage, save = clay), bold actor name, dashed dividers.
Trending hashtags (3 cols): ranked, with volume + momentum (+%, flat, down%) in mono.

Row 3:

Trending reels (8 cols): 4-up grid of 9:12 covers with warm gradient fills, duration chip, play dot, view count.
Engagement rings (4 cols): three SVG ring charts (Likes / Saves / Shares %) with % inside, delta below.

Row 4:

Follower growth (8 cols): area chart with a secondary dashed engagement-rate line, range chips (7d/30d/90d/12m), and a "Peak: +94 in a day" note.
Audience (4 cols): horizontal bars for top 6 countries using a terracotta→ochre gradient, plus a gender breakdown under a dashed rule.

Row 5:

Best time to post (12 cols): 7-row × 24-column heatmap using a 5-step terracotta ramp, with a "Less → More" legend and a callout for peak windows.
Vibe notes: dashed dividers everywhere instead of solid, mono microcopy is uppercase with wide letter-spacing, dates and numbers use the mono face, anything emotional/human uses Fraunces. Subtle paper-grain radial gradient behind everything. No emoji, no drawn illustrations, no Instagram branding — the design should feel like a private journal, not the app itself.

Include a small Tweaks panel with Theme (Cream / Bone / Cocoa) and Accent (Terracotta / Ochre / Sage / Ink) switches.
The output looks clean considering this was the first run!
The social media data are not live data. To do this, we need to follow next 3 steps:
There’s a great tool on Claude Design called ‘Draw’.
Draw a particle regions you are not happy with and give a command by clicking on that particular space. Then let it do its magic!
So now we covered how to use Claude design to build your own social media dashboard. Currently the dashboard doesn’t have access to live social media data so these are all placeholder statistics.
Check out my next article, coming soon, on how to use Claude code and Socialcrawl to fill up the dashboard with real live data using the design we created using Claude design today.
👉 OpenClaw Setup Tutorial for Beginners
👉 Claude Code Tutorial for Beginners – Setup Guide
If you've been looking for a way to automate social media content, creating a carousel with Claude Design…
The best Claude Code skills for founders I have tried 40 different plugins for my startup over the…
If you've ever tried to scrape TikTok data, you've probably hit the same wall. You search for a…