Physical Address
304 North Cardinal St.
Dorchester Center, MA 02124
Physical Address
304 North Cardinal St.
Dorchester Center, MA 02124


If you’ve ever tried to scrape TikTok data, you’ve probably hit the same wall. You search for a TikTok API, find the official one, and then discover it’s invite-only, takes weeks to get approved, and gives you almost nothing useful once you’re in. It’s not exactly built for people who just want to pull some creator profiles and video stats.
The good news is there’s a working alternative. In this tutorial, you’ll use SocialCrawl (a third-party social media API) and Claude Code to scrape TikTok data for 10 creators at once, no coding required. By the end, you’ll have a CSV file with follower counts, engagement rates, top 5 videos by views, and the most-liked comment on each video.
I ran this myself to benchmark 10 AI creators on TikTok. It took about 3 minutes and cost 100 API credits.
Here’s how to do it.
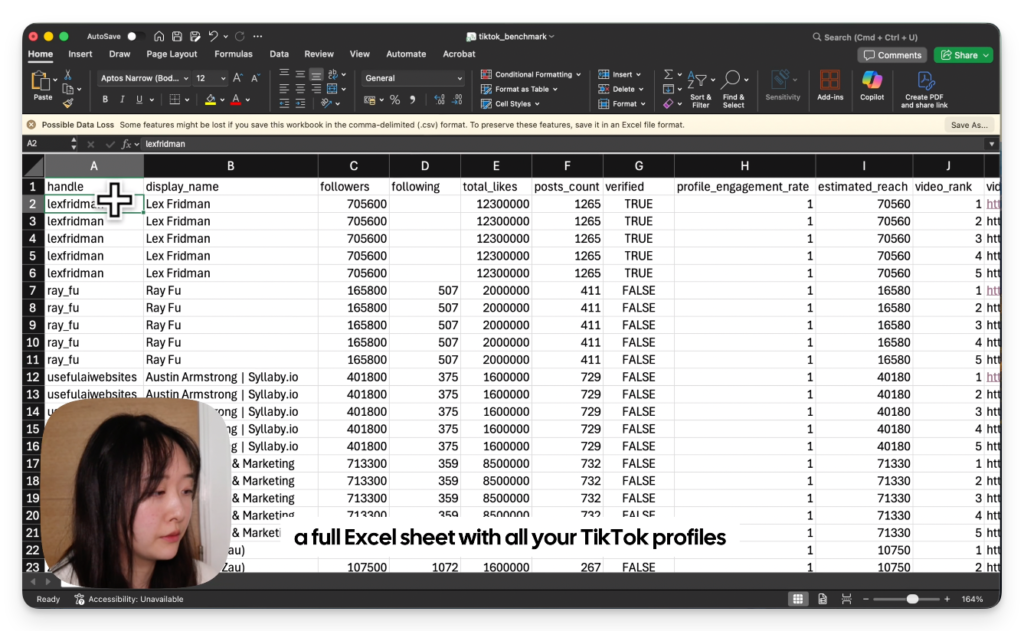
Before we get into steps, it’s worth being clear about the output. You’re not just getting a list of follower counts. The CSV you end up with has one row per video, and each row includes the creator’s profile-level data (followers, total likes, engagement rate, verified status) alongside the specific video’s stats (view count, likes, shares, comments) and the text of the top-liked comment on that video.
Two things:
A SocialCrawl account. Go to socialcrawl.dev and create a free account. Every new account starts with 100 free credits. Running this full benchmark for 10 creators costs around 120 credits total, so if you want to test with fewer creators first (2 or 3), you can do the whole thing for free. Once you’re in, grab your API key from the dashboard. It starts with sc_.
Claude Code. You don’t necessarily need Claude, it can be Codex or your favourite AI coding tool.
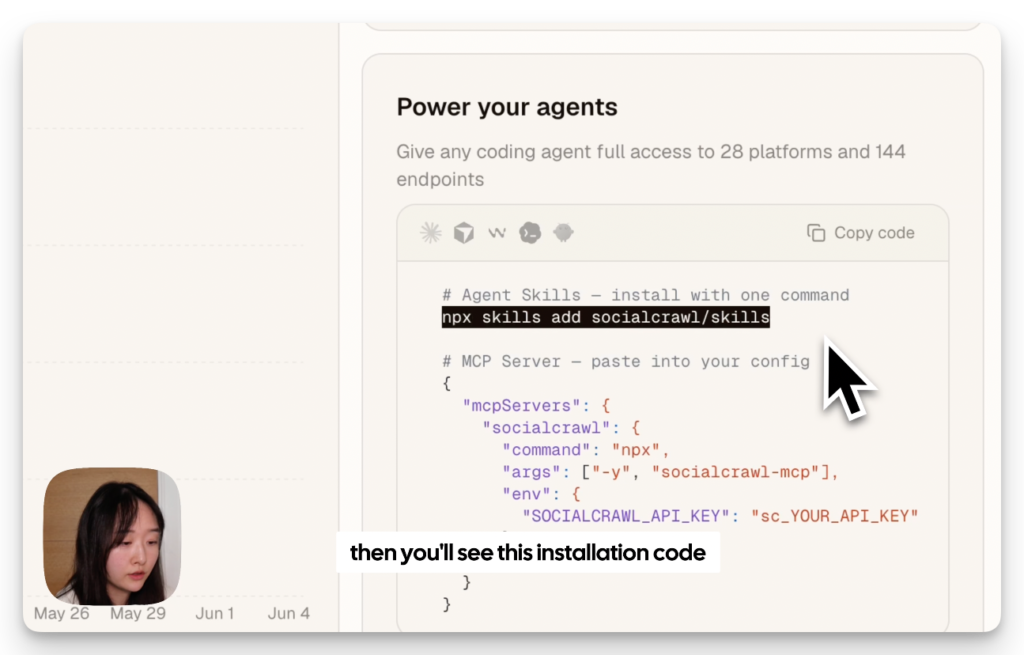
Go to socialcrawl.dev and login. Go to your dashboard to get your own API key and copy and paste the installation code to your IDE. Claude will setup socialcrawl automatically on your environment.
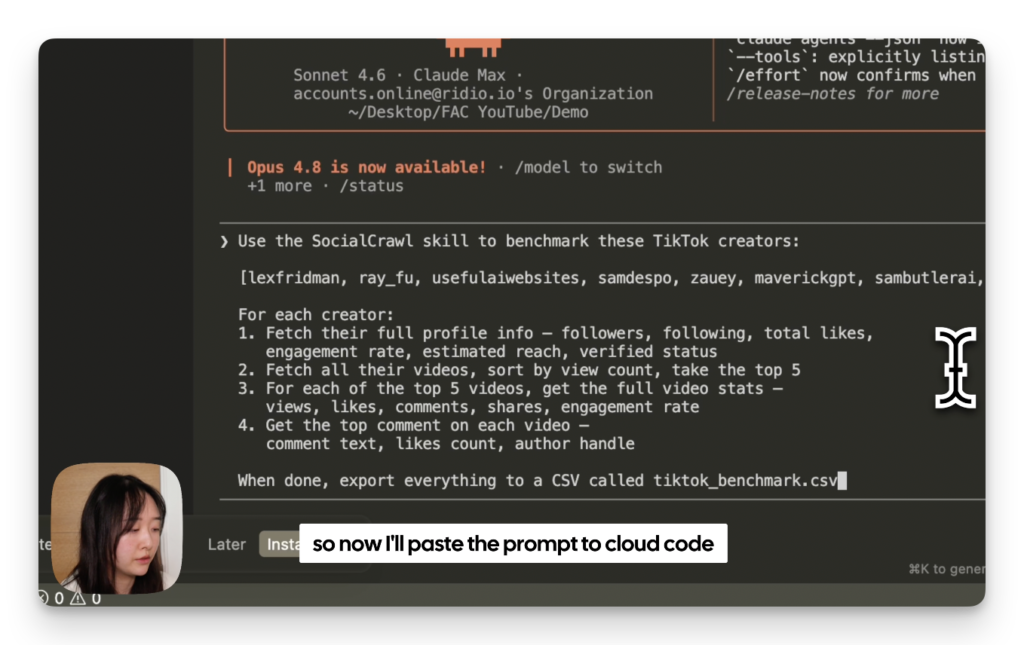
Open Claude Code in your terminal. Then paste the prompt below, with your own list of TikTok handles where it says [YOUR HANDLES HERE]. No @ symbol, just the handle names separated by commas.
Use the SocialCrawl skill to benchmark these TikTok creators:

[YOUR HANDLES HERE]

For each creator:
1. Fetch their full profile info — followers, following, total likes,
   engagement rate, estimated reach, verified status
2. Fetch all their videos, sort by view count, take the top 5
3. For each of the top 5 videos, get the full video stats —
   views, likes, comments, shares, engagement rate
4. Get the top comment on each video —
   comment text, likes count, author handle

When done, export everything to a CSV called tiktok_benchmark.csv
Not sure which handles to use? Here’s the list I used to test: lexfridman, mreflow, howtoai, mrdbourke, wes.roth, aibreakfast, aiexplained, sirajraval, techwithtim, codewithharry. Swap in whoever you actually want to research.
Hit enter.
Claude Code will work through the list on its own. You’ll see it fetching each creator’s profile, then pulling their video list, then going video by video for stats and comment data. For 10 creators, that’s about 120 API calls in total, and it takes a couple of minutes to finish.
When it’s done, a file called tiktok_benchmark.csv will appear in your project folder.
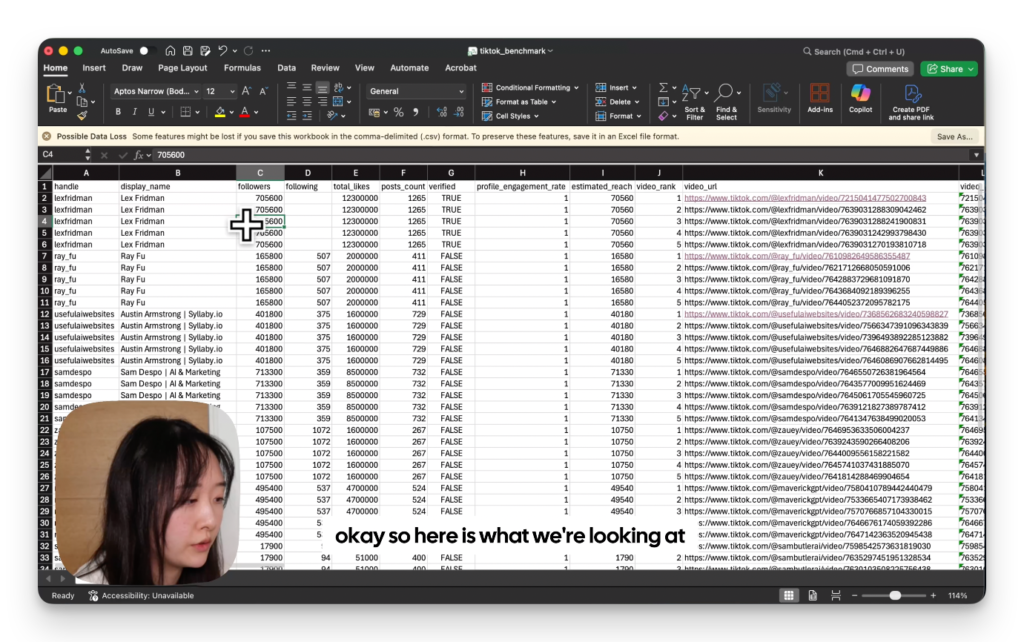
Open the CSV in Google Sheets or Excel. You’ll see one row per video, with the creator profile data in the first few columns and the video-specific data after that.
A few things worth checking first:
The engagement rate column is calculated by SocialCrawl, so you don’t have to do any maths. Sort by this column to see which creators are actually getting strong audience interaction relative to their follower count. A creator with 500k followers and a 0.3% engagement rate tells a different story than one with 80k followers and a 4% rate.
Sorting by view count within each creator shows whether their reach is consistent or driven by a couple of viral videos. Both can be fine depending on your use case, but it’s good to know which you’re looking at.
The top comment column is worth reading slowly. It’s tempting to skim, but the comments that got the most likes tend to be the ones that say what lots of people were thinking. That’s signal.
One honest note: this is a snapshot. The data reflects what’s true right now. If you want to track changes over time, you’d need to run the benchmark again later and compare the two CSVs. I’ll cover that workflow in a separate post.
If 10 creators felt like a good test, try scaling it. The prompt works with any number of handles. You can also swap TikTok for Instagram or YouTube by changing the platform in the SocialCrawl endpoints, and the overall structure stays the same.
If you want to go deeper on any one creator, SocialCrawl also lets you pull all their videos (not just the top 5), search their comments by keyword, or get post-level data going back months. Those are all worth separate tutorials, and I’ll link them below as they go live.
For now, you’ve got the data. The next step is just deciding what to do with it.
👉 Claude Design Tutorial: Build A Social Media Dashboard
👉 How to Give Claude Code Social Media data
👉 Claude Code Tutorial for Beginners – Setup Guide
What People Really Think About Claude Opus 4.8 Claude Opus 4.8 dropped on May 28, 2026, and the…
How to find viral hooks for reels in your niche (using real TikTok data) If your reels aren't…
How to Find Winning TikTok Shop Products With AI (Full Pipeline, One Prompt) Most TikTok Shop product research…